
The audio measurement technology of the future!
The system of PC or tablet, sound card and measuring programme replaces conventional audio measuring instruments such as oscilloscope, generator, level recorder, distortion factor measuring bridge and voltmeter.
 The operation is self-explanatory thanks to the ATB programmes that have been tried and tested thousands of times and does not require a long training period. Thanks to the calibration function as well as very elaborate correlation calculations, even the interested layman measures correctly. The programme extends the possibilities of the measuring instruments by measurements in the time domain with synchronised generators. The Time Correlation function makes the measurement of distances and delays very accurate. This enables the correct delay setting for the DSP. The waterfall diagram is generated with the cosine burst measurement signal and shows the oscillation in and out of the DSP and the loudspeaker. Through the representation it is possible to distinguish between resonances and reflections. This is important for room correction because only resonances, modes, can be corrected.
![]()
The ATB programme has powerful features:
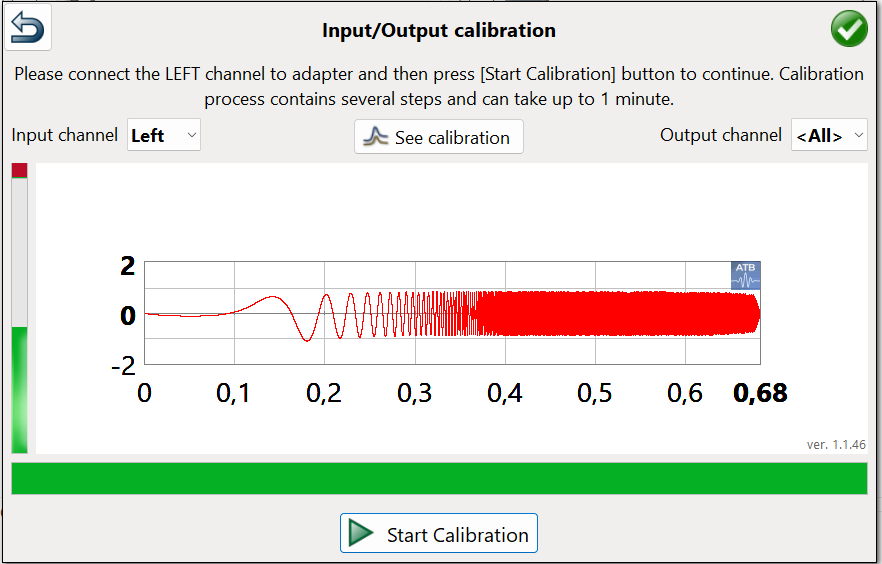
– Automatic calibration with the Time Calibration function.
– Frequency and phase responses are measured by analysing with the corellation and the measurement signals ATB periodic noise and Longchirp sine. The acoustic, electrical and impedance measurements have their own menus.
– Quasi room-independent loudspeaker measurement, anechoic measurement
– High-resolution frequency analyser and real-time analyser with third-octave display (RTA)
– Distortion measurement with display of THD or 2nd, 3rd, 4th, 5th order harmonics.
– Memory oscilloscope with sophisticated trigger function and synchronisation with the generator.
– Generator for sine, square and cosine-burst and as continuous signal or as burst with selectable period length. Pulse for dynamic measurement analysis.
– Output of the surround channels, depending on the sound card. Bluetooth output
– Waterfall diagram with cosine burst measurement signal for displaying transient behaviour as well as resonances and reflections separately.
– Waterfall with wavelet analysis.
– Impulsresponse
– Reverberation Time T60
The ATB Audio Analyzer programme runs under Windows 7, 8, 10 and 11, 64bit or 32bit
Depending on the sound card, measurements can be made with one or two channels.
For the frequency response measurements, you can choose between the proven stimuli correlated ATB noise or the sine sweep.

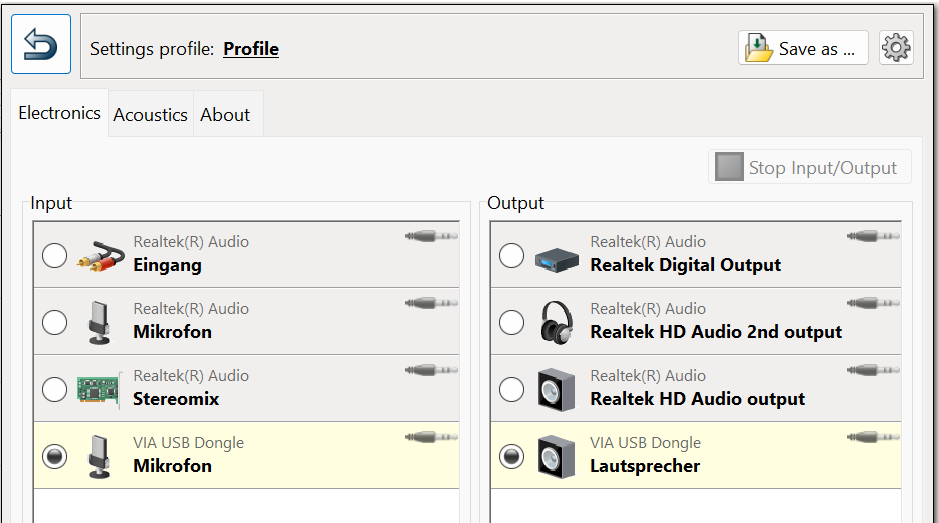
The Setting menu is used to prepare the measurements after installation.
This begins with the selection of the sound card.
Depending on the sound card and computer, 192kHz, 24Bit can be selected as the highest resolution.
The setting is saved with profiles. One profile is the measurement of the surround system: input USB microphone, output HDMI. Another is the impedance measurement with measuring adapter: input sound card microphone, output sound card loudspeaker.
The programme shows the correct input and output voltages or levels according to the usual measuring devices.For this purpose, the sound card is calibrated. For this purpose, the measuring adapter is connected to the input and output of the sound card.
Measuringthe output voltage with a multimeter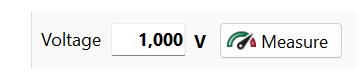

2-Channel Memory Oscilloscope
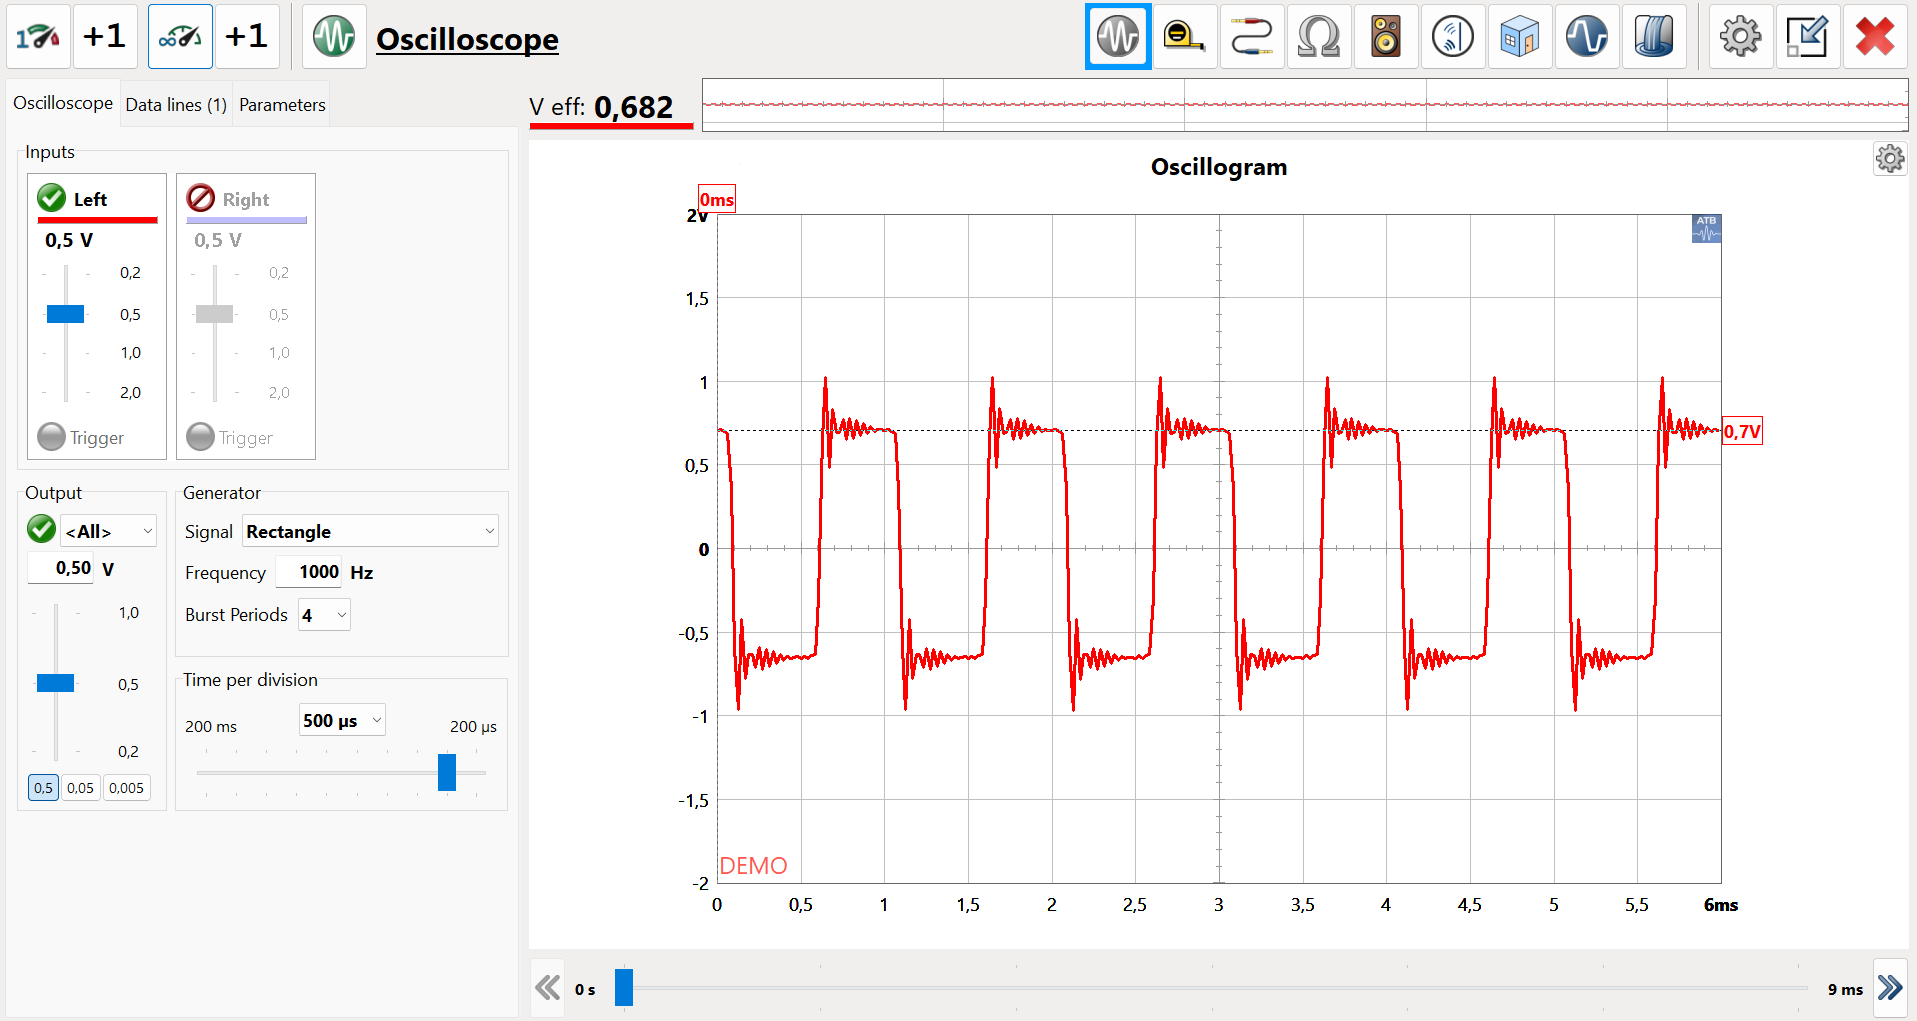
The oscilloscope contains a generator and voltmeter. The generator is synchronised with the oscilloscope so that running times and delays can be measured very accurately.
An RMS voltmeter is included in the oscilloscope.

Distance Meter
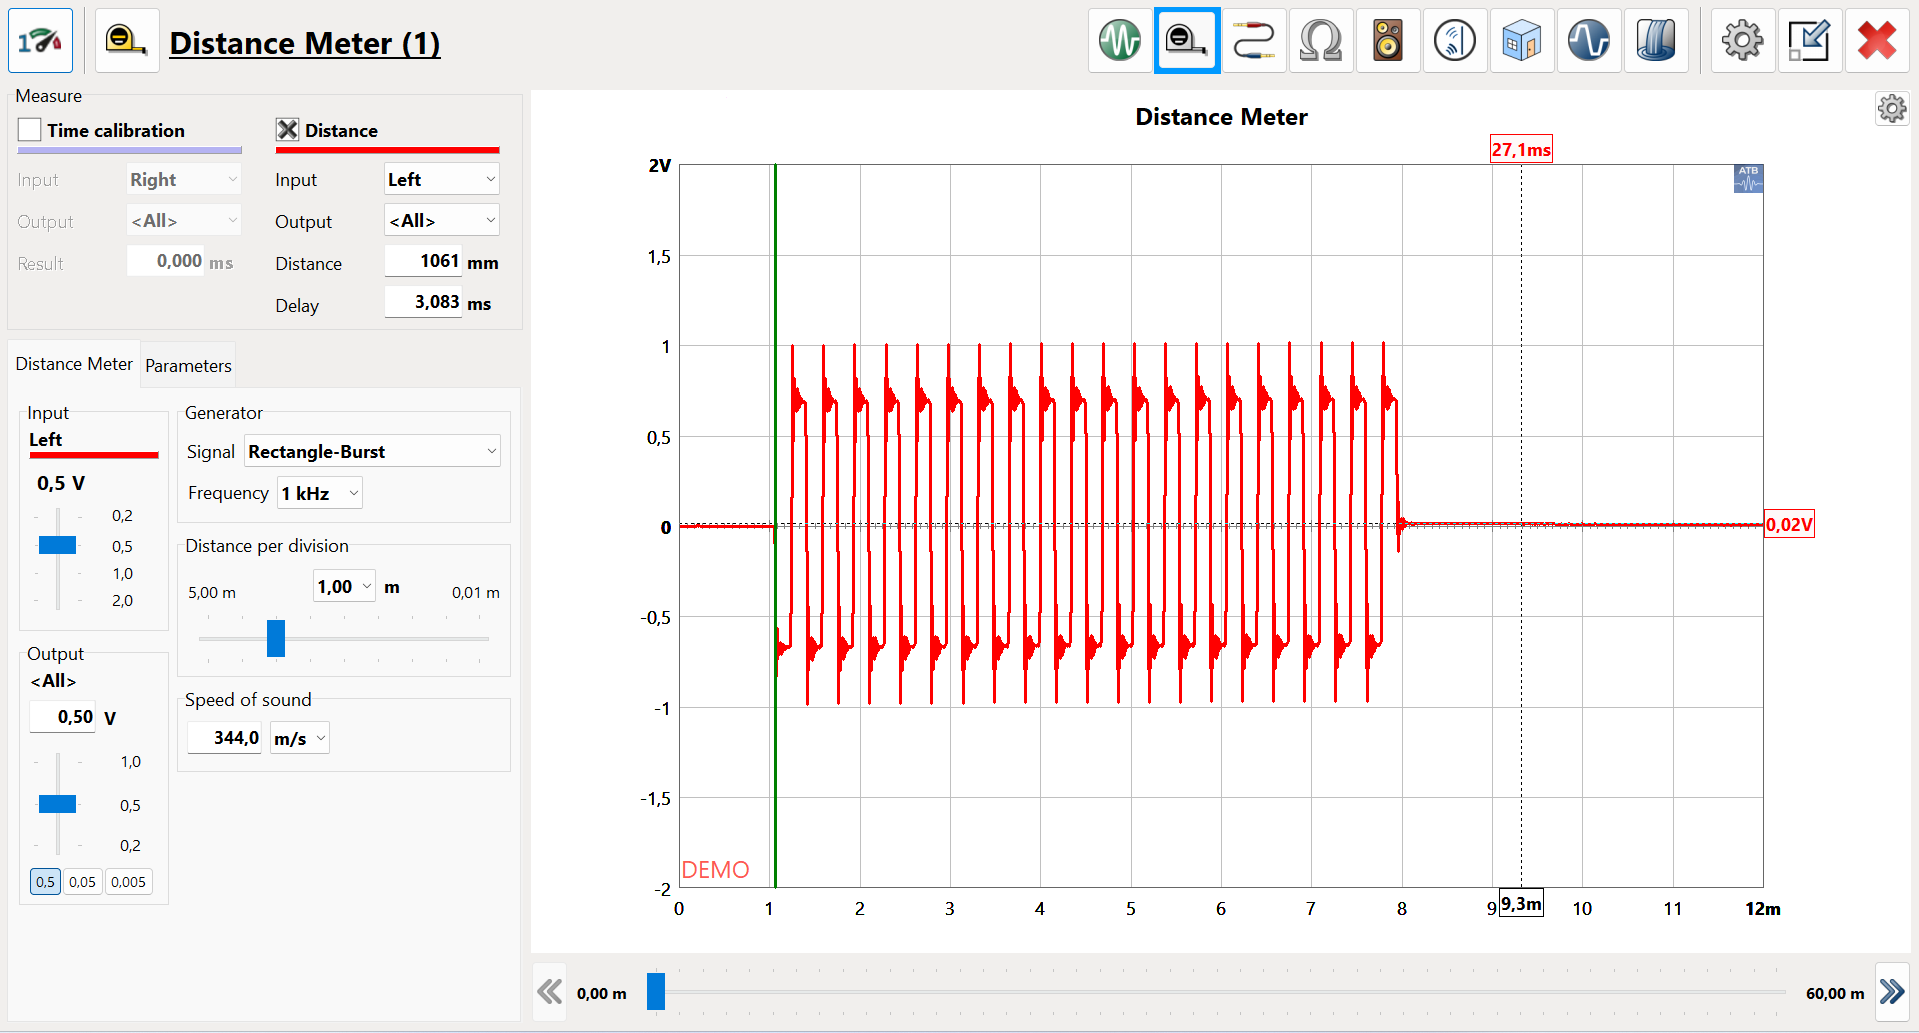
The rangefinder also includes the Time Calibration function. This calibration enables accurate distance and delay measurements regardless of the timing of the Windows operating system.

Electrical amplitude frequency response measurement, Manitude
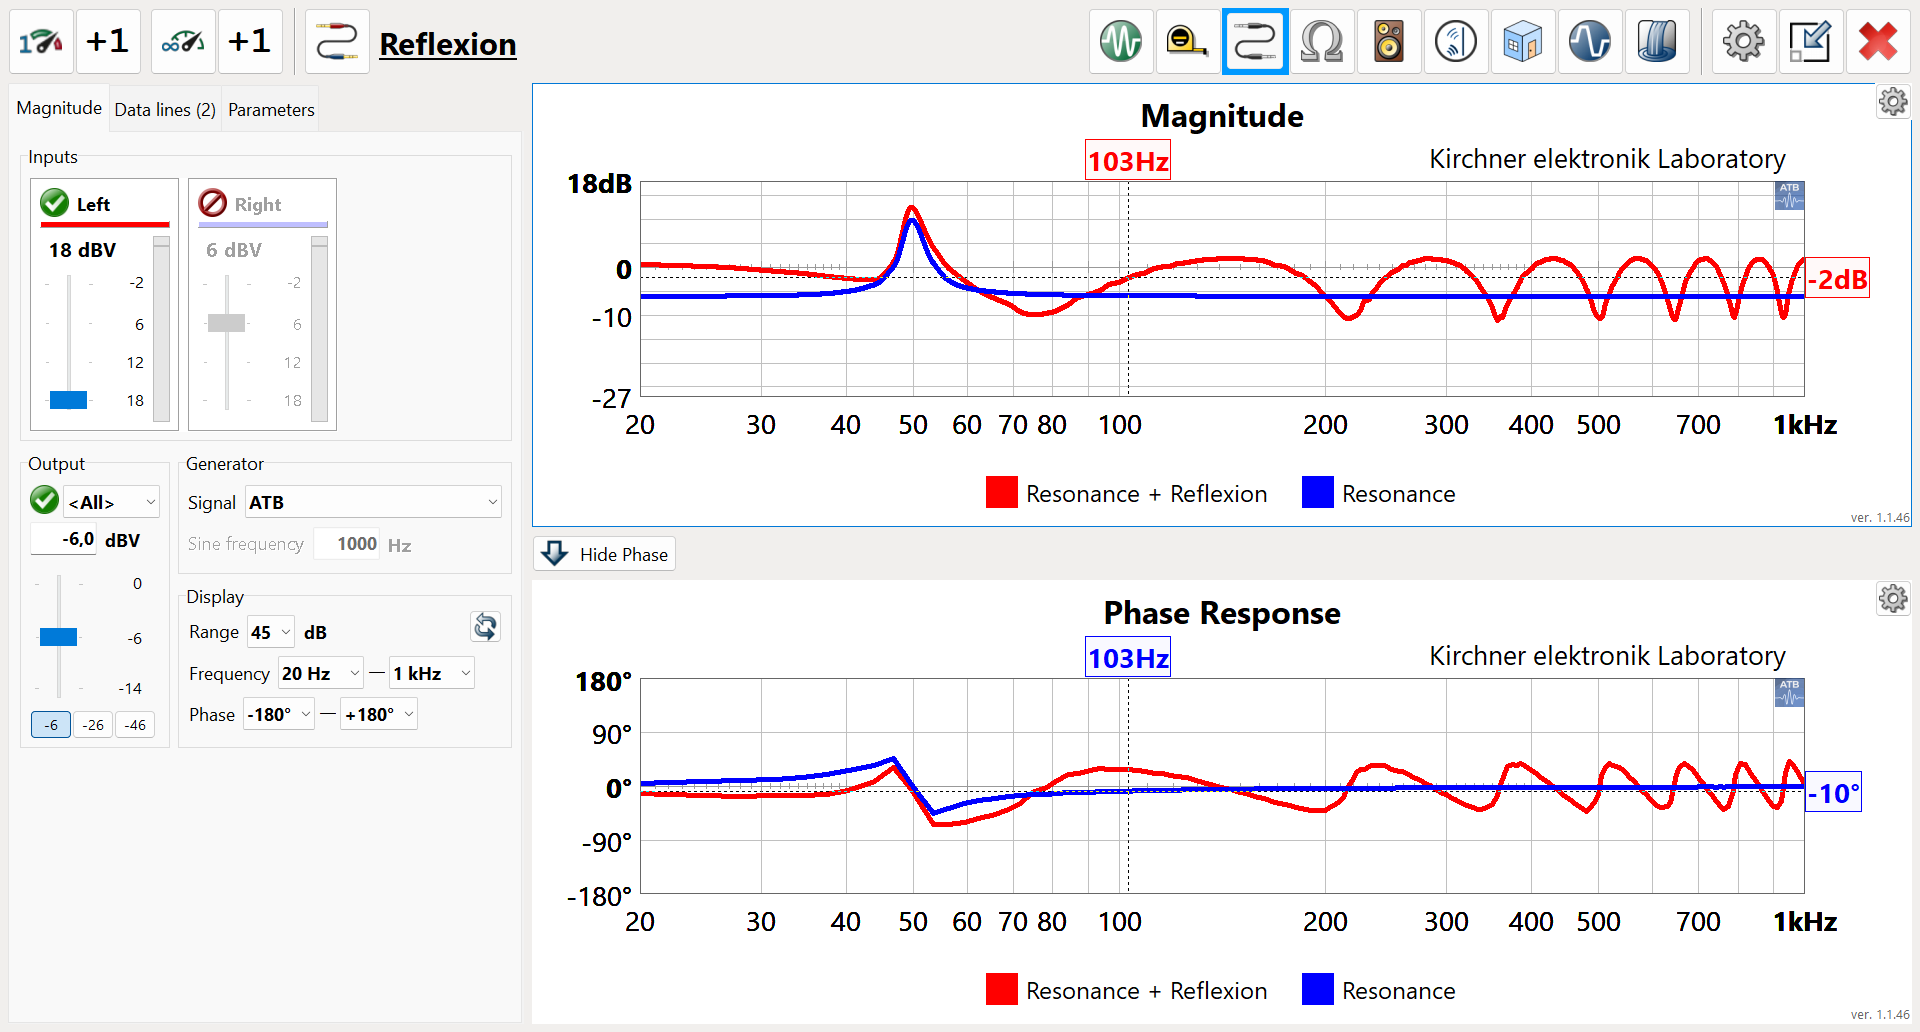
Measurement of high-order DSP filters. In the phase measurement, the jumps occur when the signal becomes smaller – 38dB. At the crossover frequency, the phase curves lie on top of each other, which shows that the filters are matched to each other.

Impedance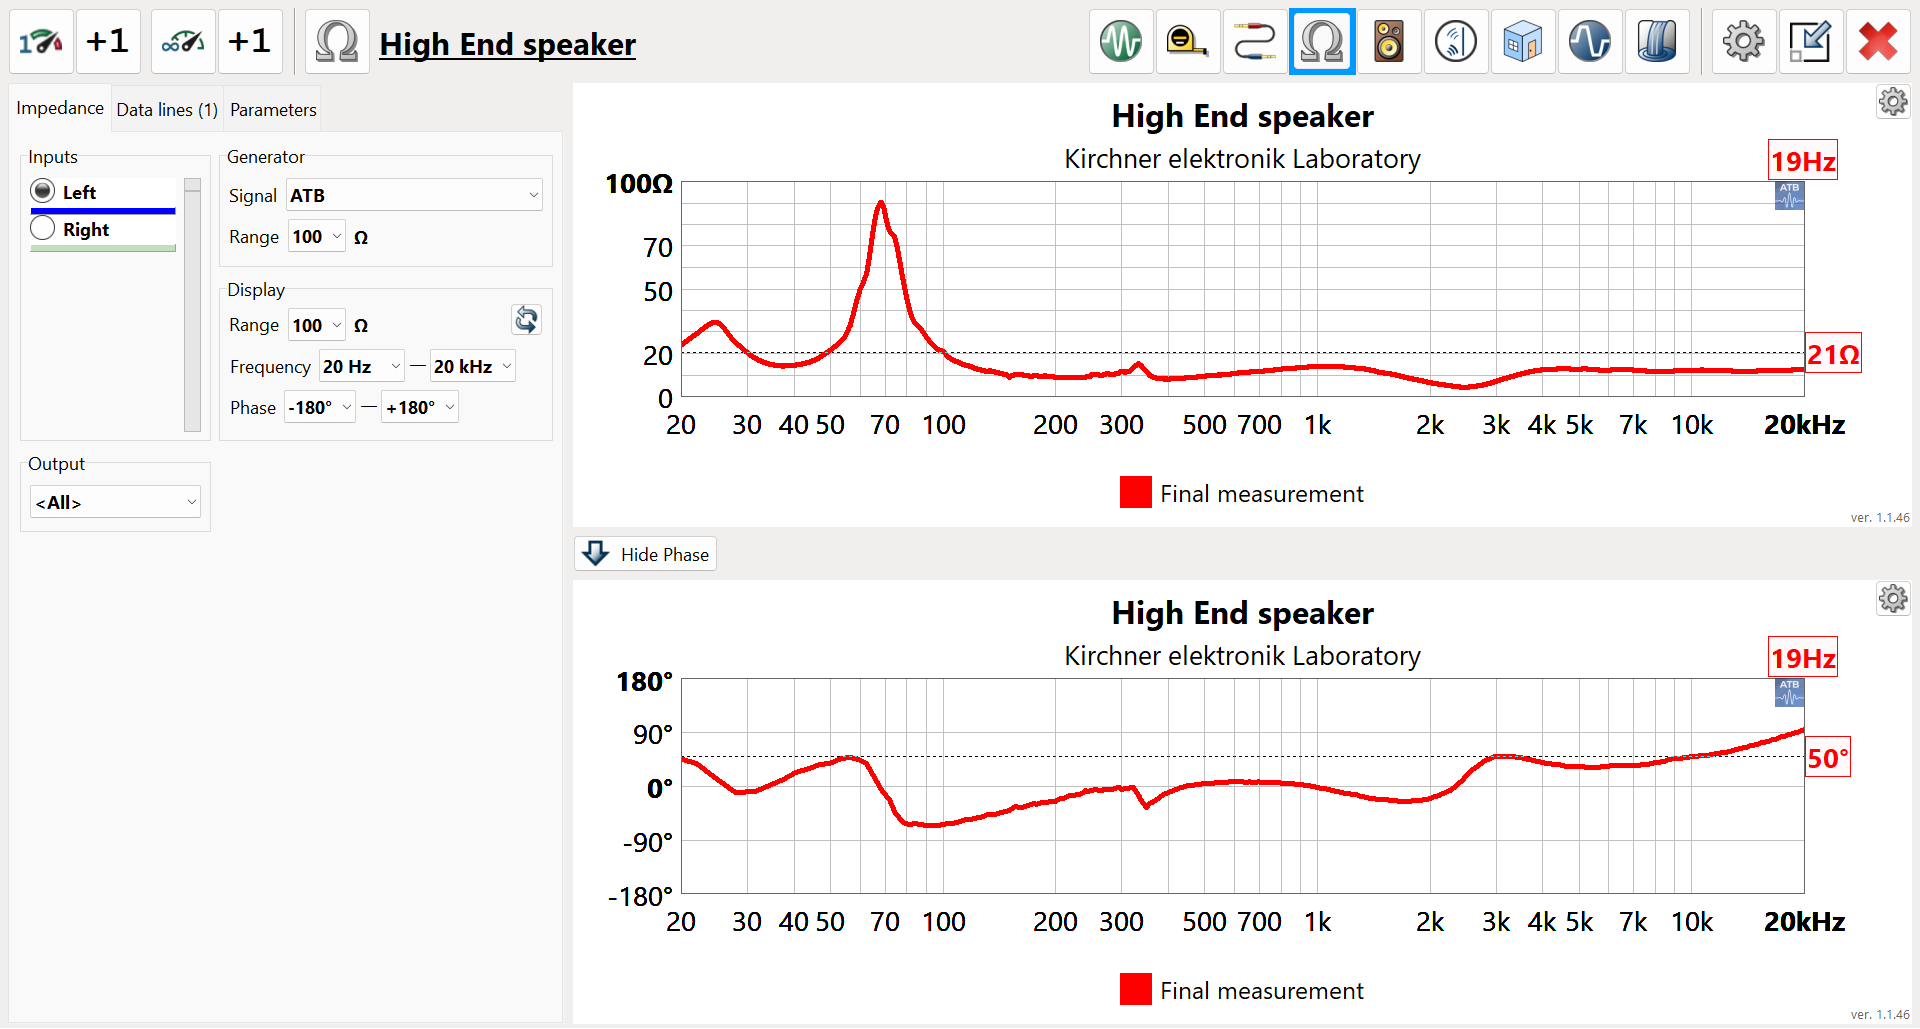
The phase curve with the range from -40° to +30° shows that the loudspeaker can also be operated with simple amplifiers.

SPL, RTA and Frequency Analyser
SPL, sound pressure frequency response measurement with acoustic phase measurement. The correlation function automatically takes the microphone distance into account when measuring the frequency response. With the ATB measuring signal, the signal can also be transmitted via Bluetooth or played back from a CD or stick. This enables measurements in the car without direct connection to the stereo system. Since the ATB signal is deterministic, periodic, the measurements become much more accurate than with the usual pink noise. This is especially evident in the low frequency range due to a stable display.
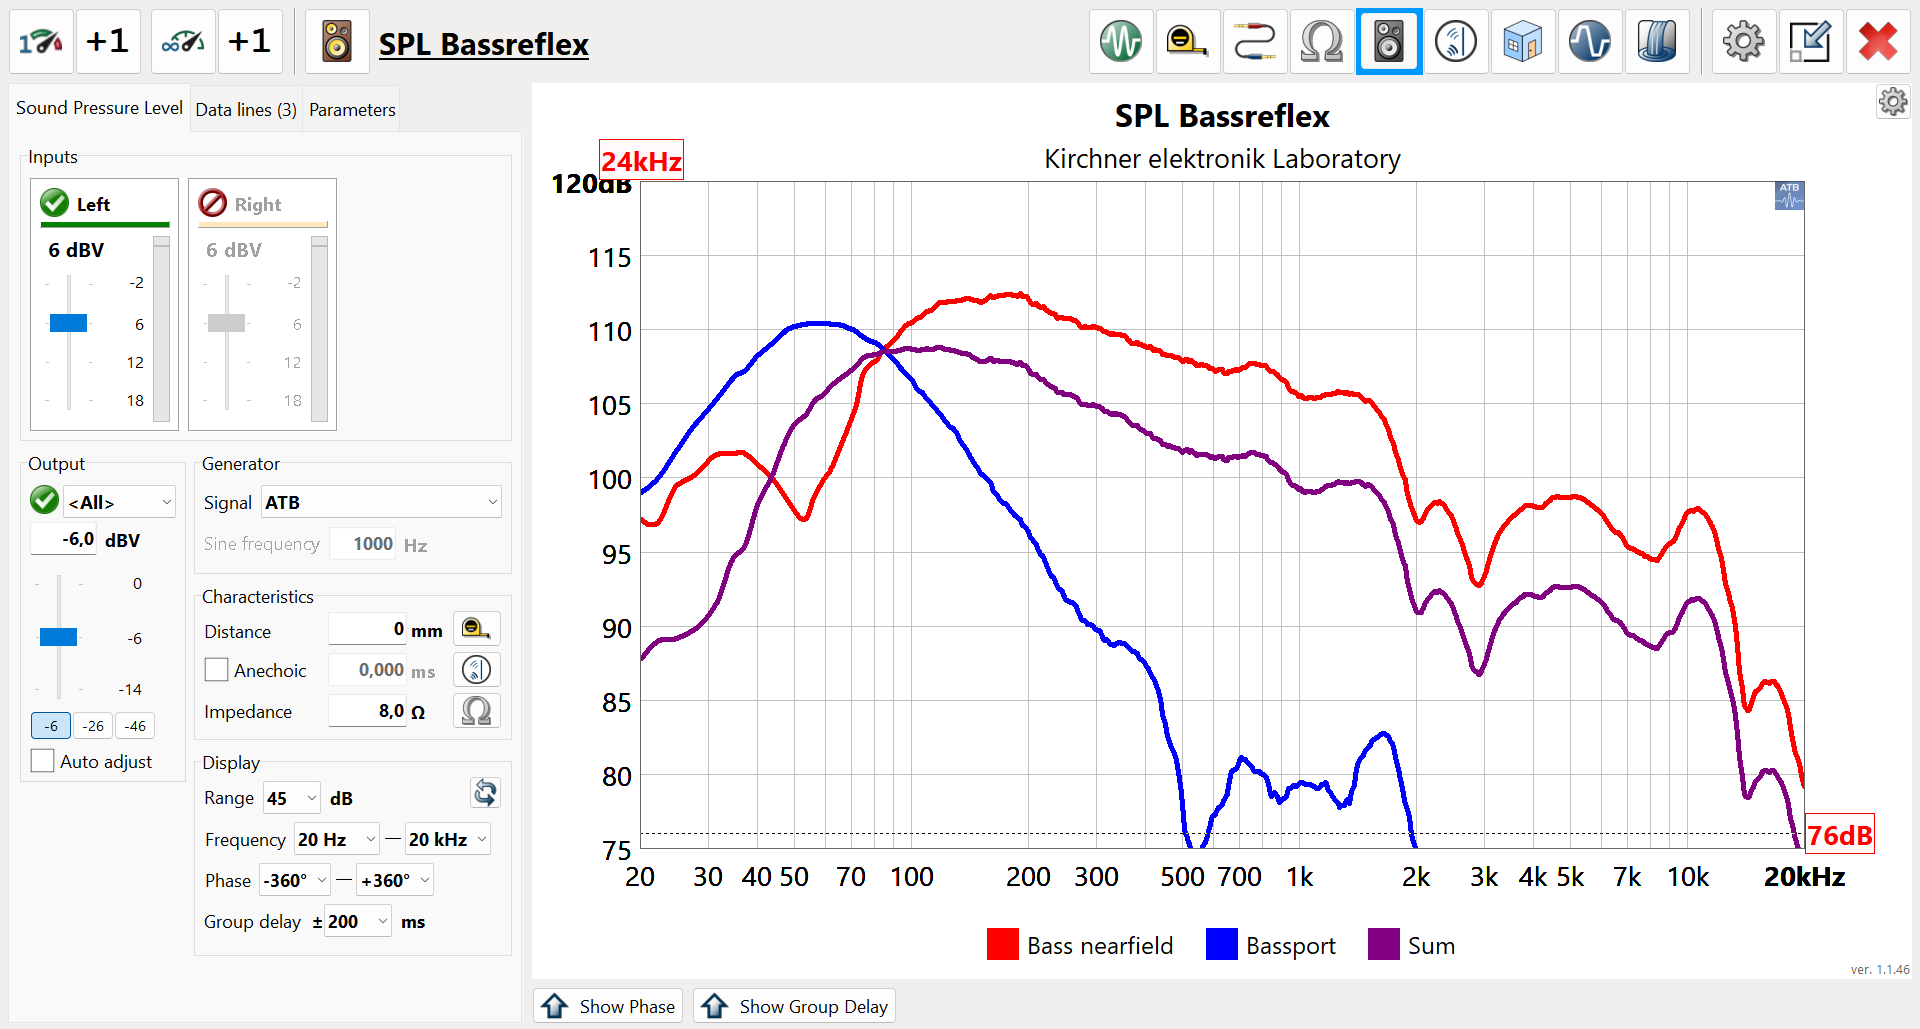
Quasi room-independent loudspeaker measurement, anechoic measurement
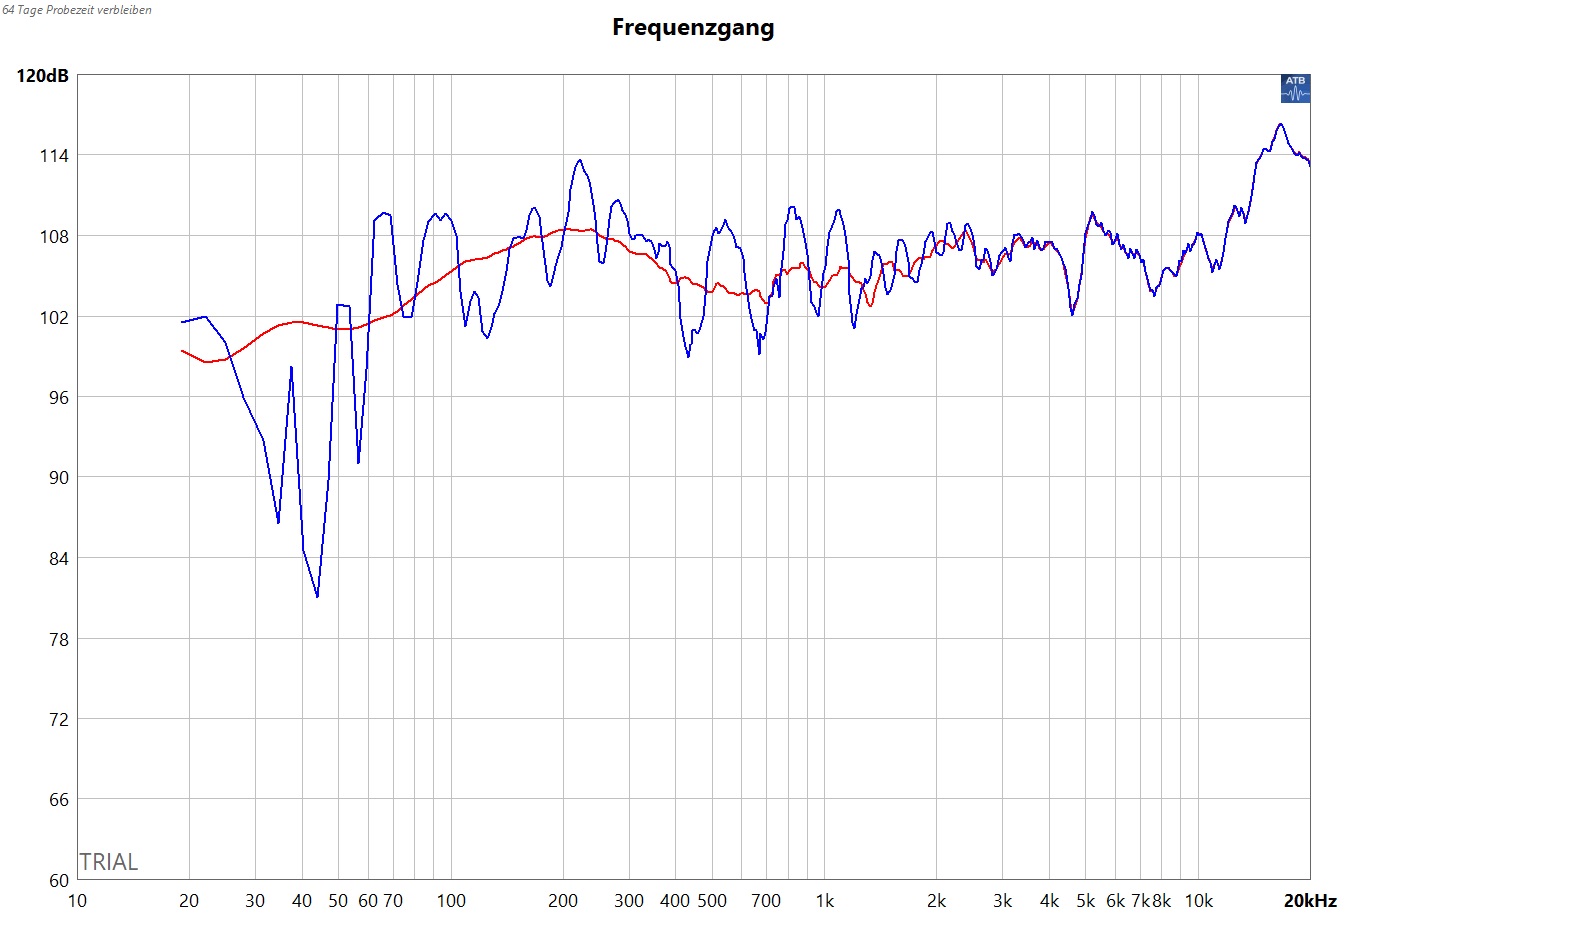
The blue curve shows the SPL measurement in the room. The room resonances are clearly visible. With a time window for the calculation of the frequency response, the room reflections are no longer included in the plot, red curve. As the frequencies from 20Hz to 200Hz are no longer displayed correctly due to the reduction of the time window, a near field measurement is carried out for this frequency range. With the combine function, the complete frequency response is shown.
The RTA measurement is called up with the sine signal. Here the display can be in 1/24 – 1 octave steps.
For frequency analysis, smoothing is switched off. For testing the modulation of a DSP or amplifier, a sine signal with a selectable frequency is supplied by the generator.

THD, distortion factor measurement 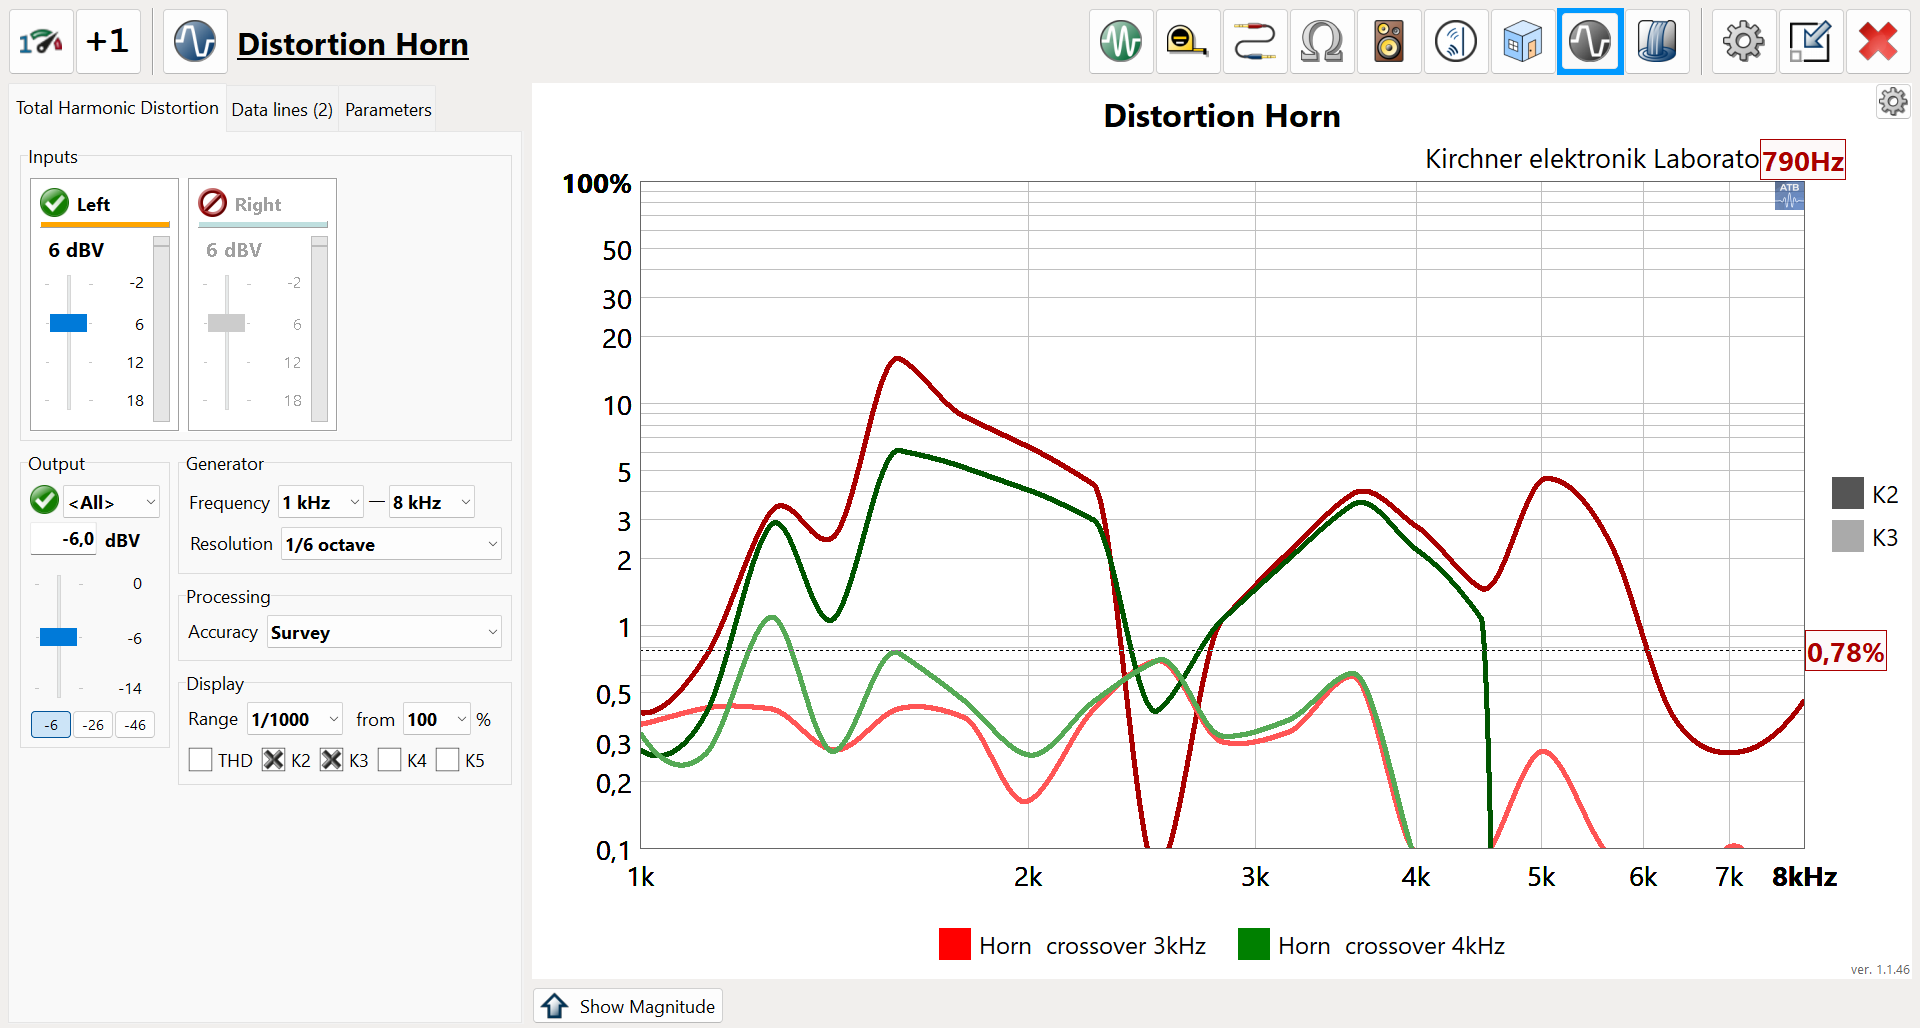
The distortion measurement shows the distortion spectrum of a small high-end loudspeaker.
The upper red line shows the frequency response of the loudspeaker. This is important because if the level is too low, the distortion cannot be calculated correctly.
The distortion factor shows that the speaker should be driven with a lower cut-off frequency of 200Hz. In the midrange a K2 of < 0.1% is not audible. Above 3kHz the peaks of K5, K4, K3 and K2 are outside the audible range.

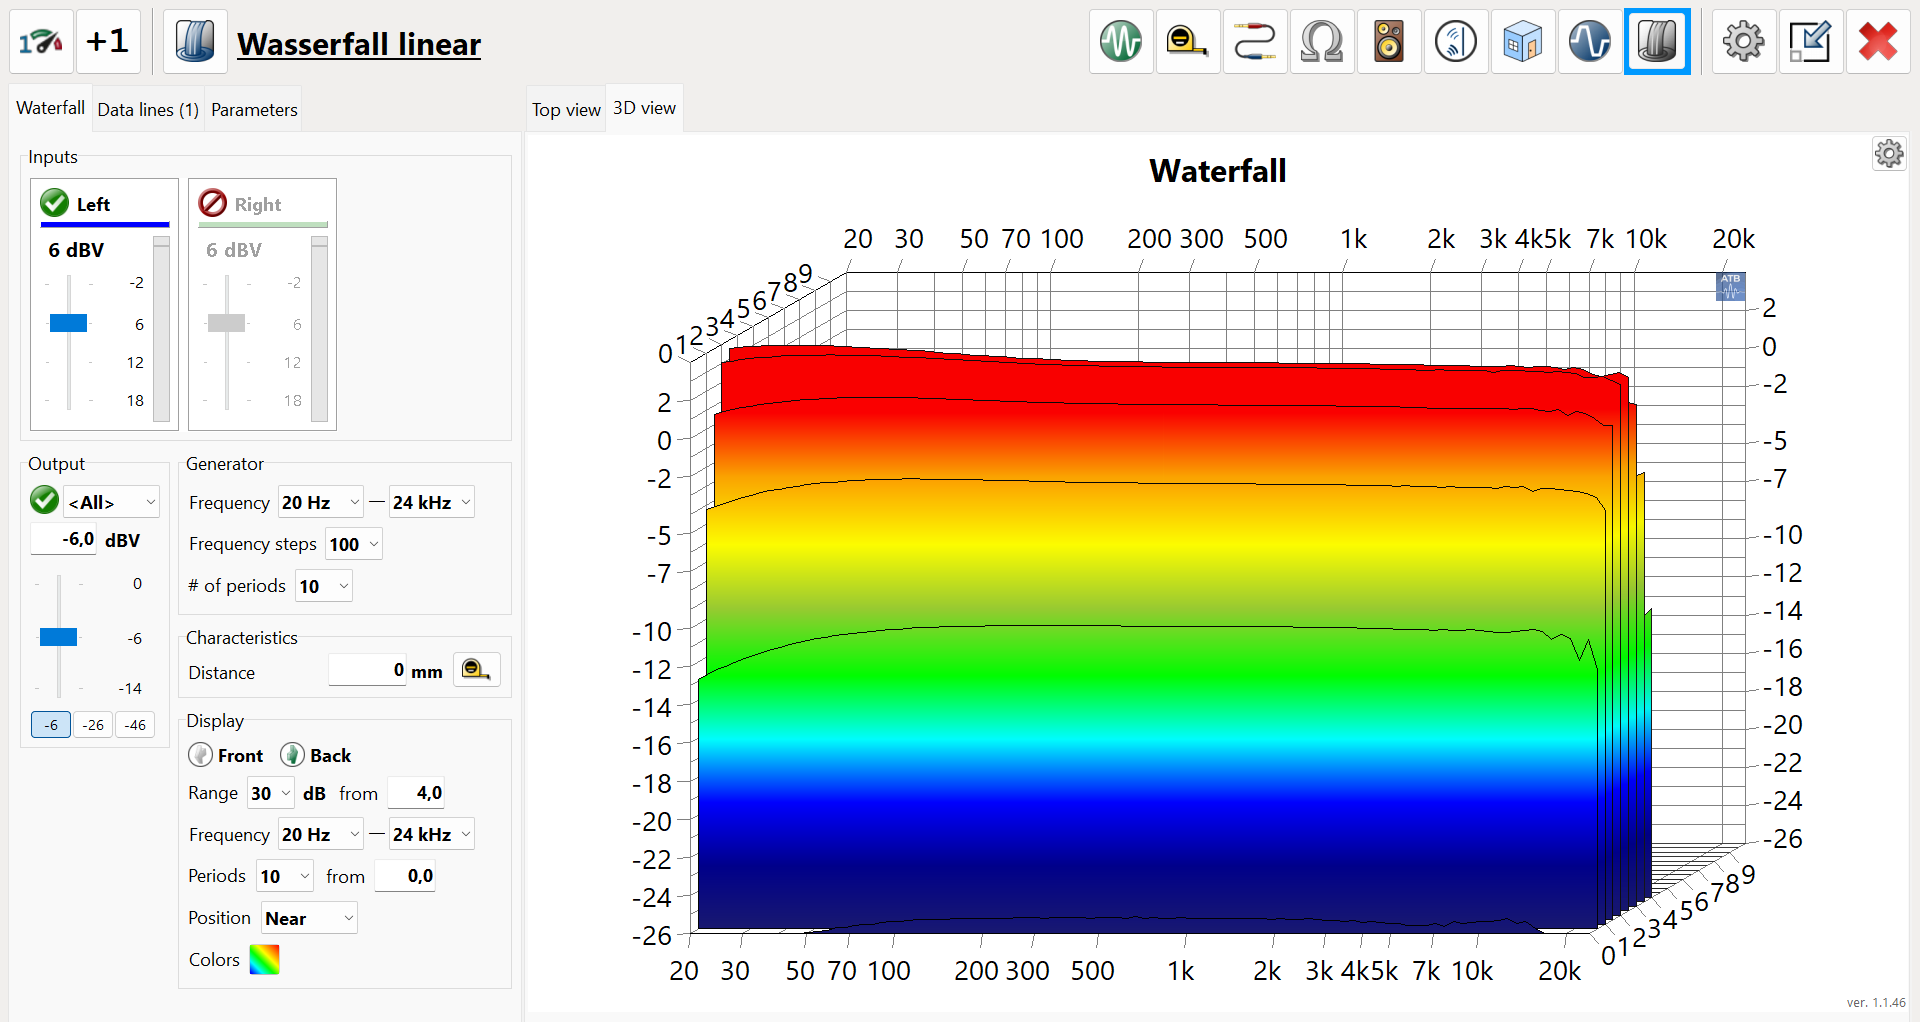
Waterfall Measurement
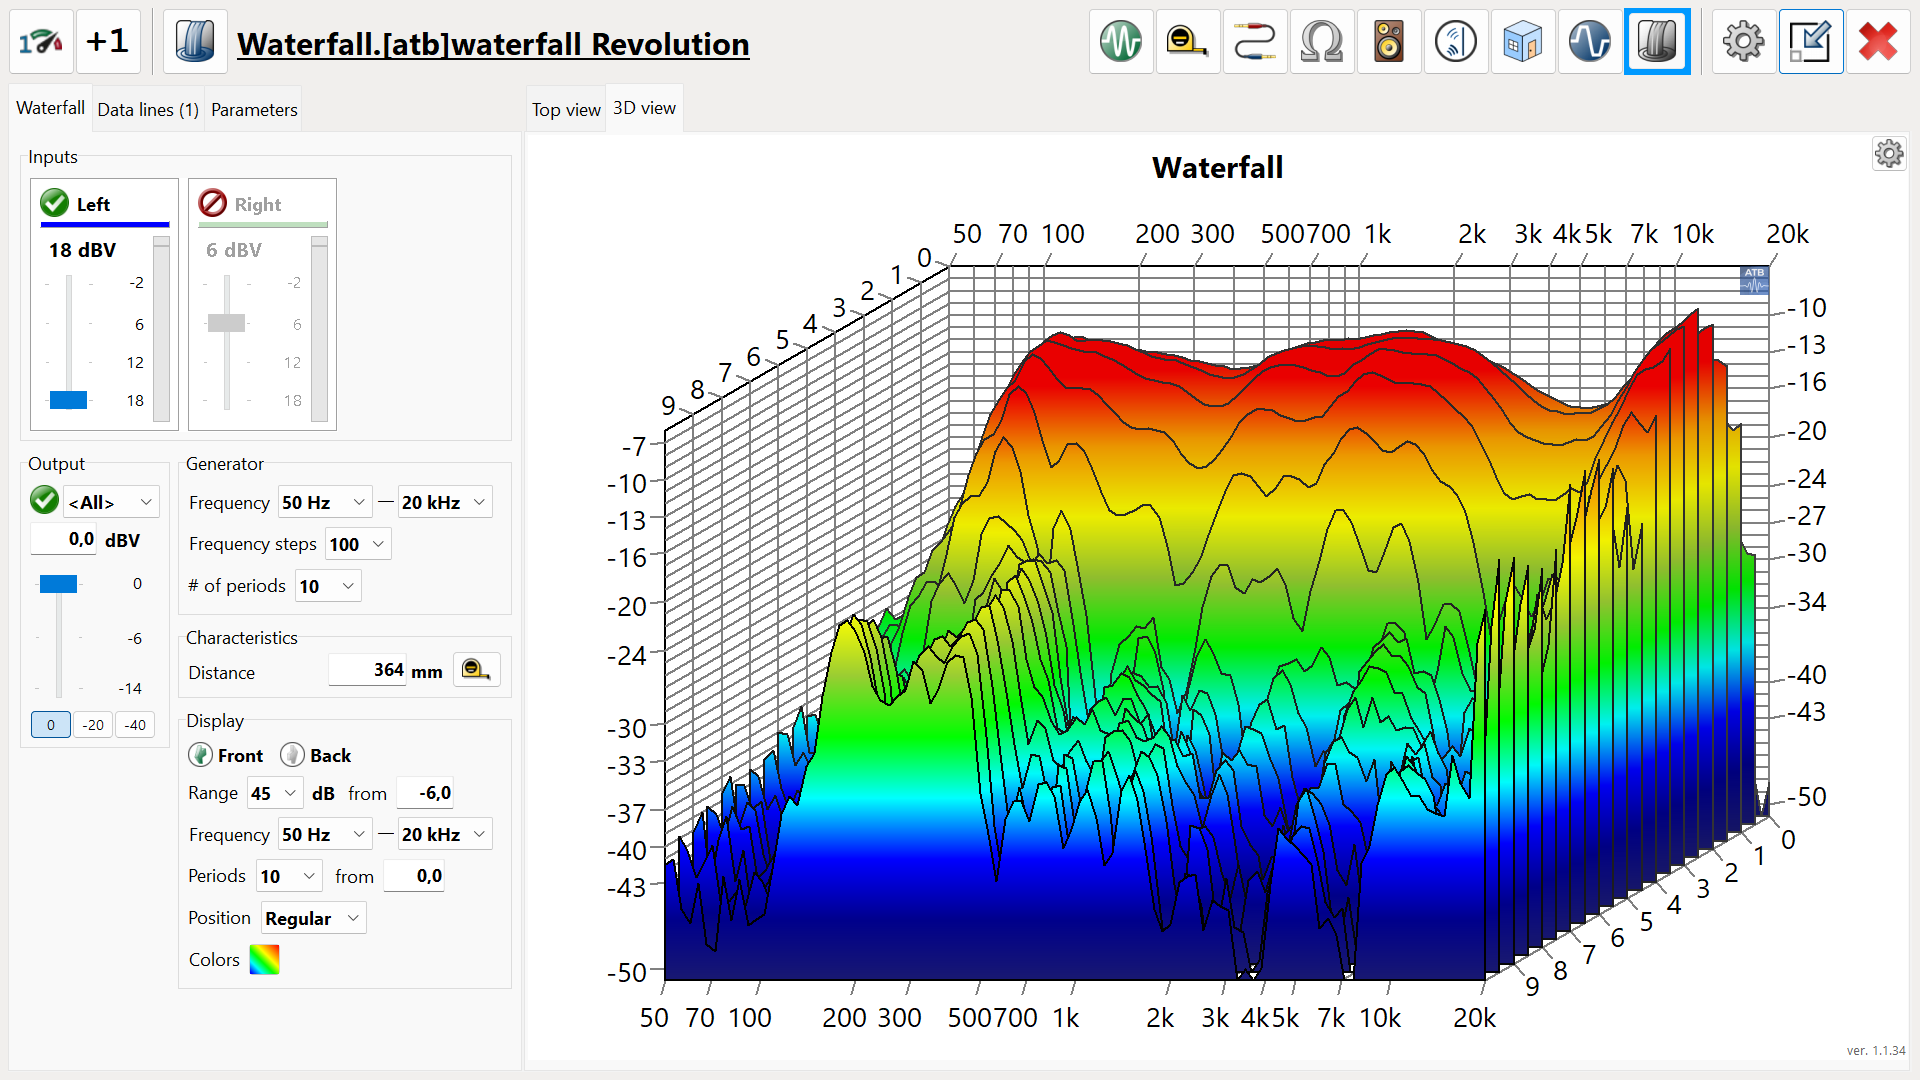
The waterfall diagram shows a loudspeaker measured in room.
When measuring with the cosine-burst, the time axis is displayed in periods. By normalising the time axis, the representation can be made over the entire frequency range. In contrast to the usual representations with time axis, the decay of resonances in the high frequency range can also be shown. With the time axis, the temporal resolution is too low.
At 80Hz a mountain range can be seen. Since this has the direction of the time axis, it is a resonance. This could be equalised with a DSP. For this, the quality of the resonance must be known. If this is set incorrectly, the sound will be distorted. The measurement with the cosine-burst shows the quality.
At the frequencies of 200hz and 400hz, two mountain ranges can be seen in the foreground. These are caused by reflections from the walls of the room. This can be clearly seen by the mountain range running diagonally to the right.
At 20kHz the tweeter has a resonance.
The top view is a modified Spectrogram or Wavelet representation.
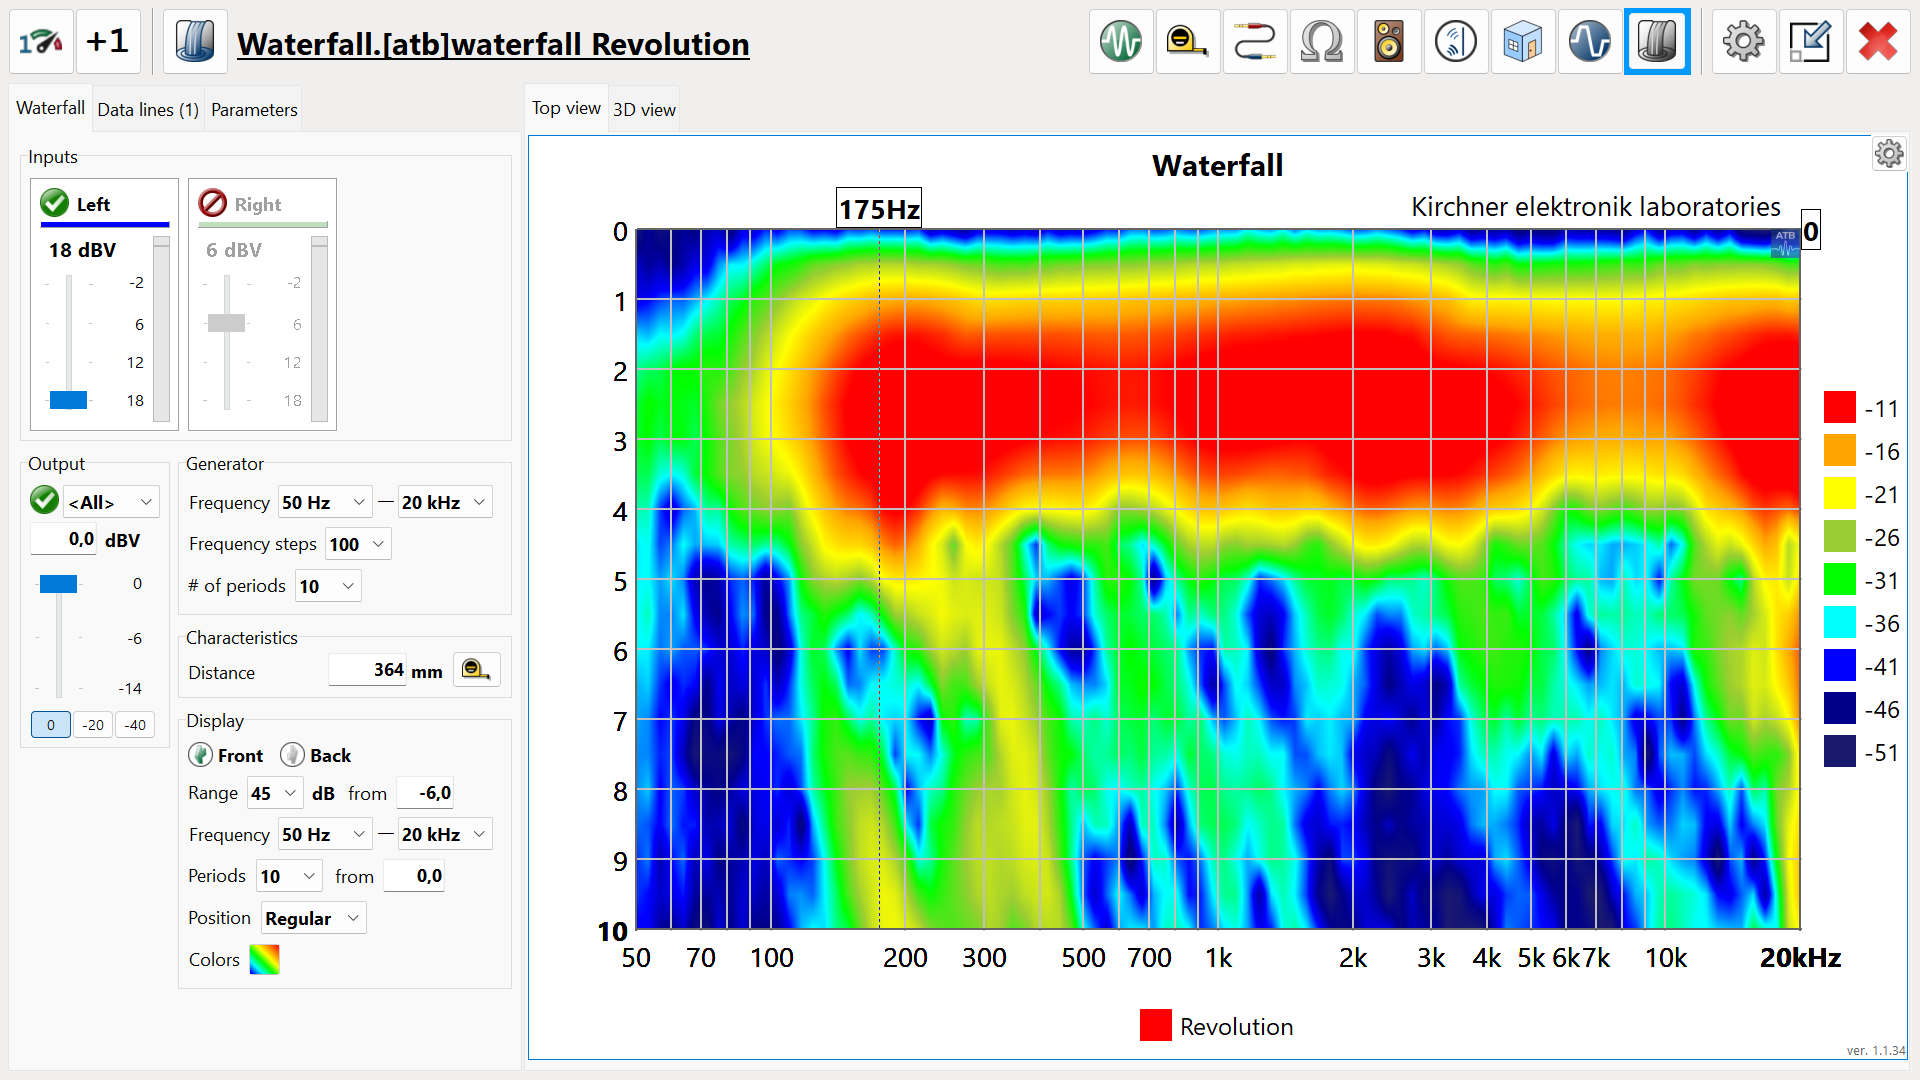
In the top view, the characteristics of the room and the loudspeaker described above are shown more clearly.
 Impulse Response
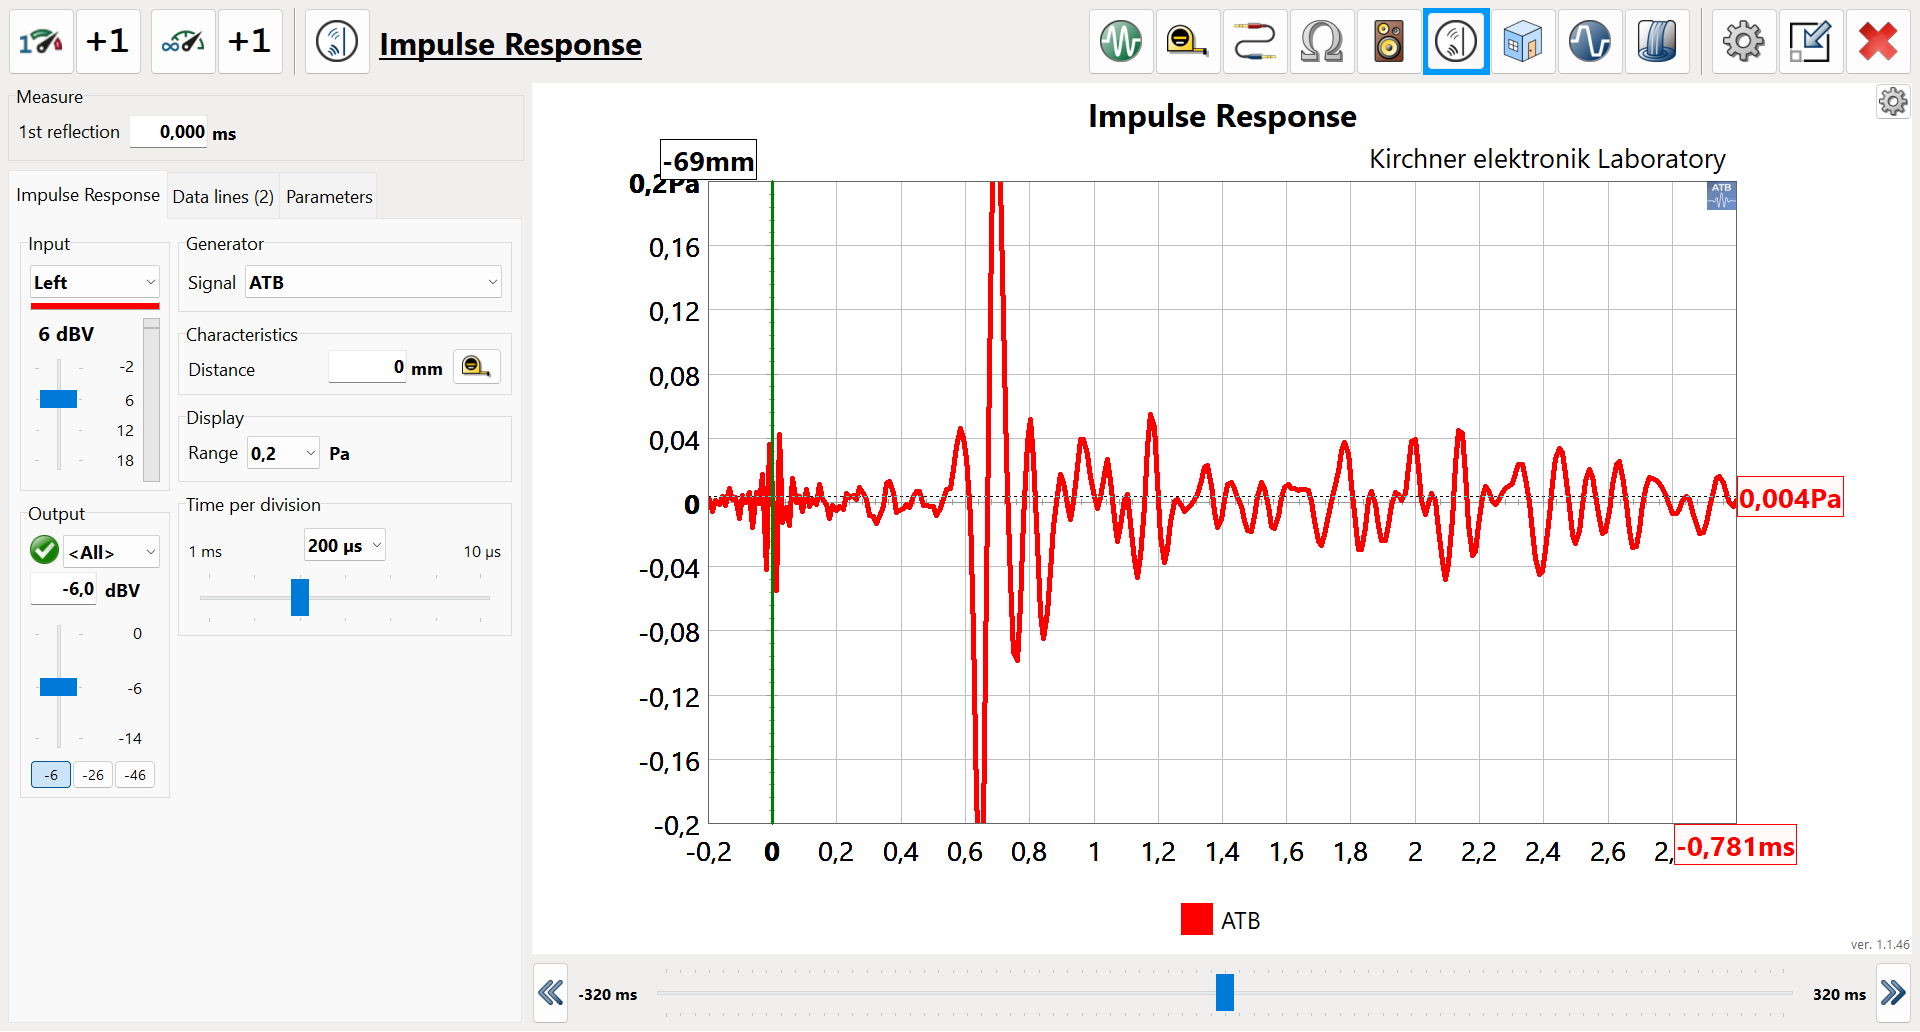
The impulse response measurement measures the reflections of a room.
It shows the time for the first reflection. This is set in the SPL quasi anechoic loudspeaker measurement. Thereby the time window for the FFT is set.
 Reverberation Time T60
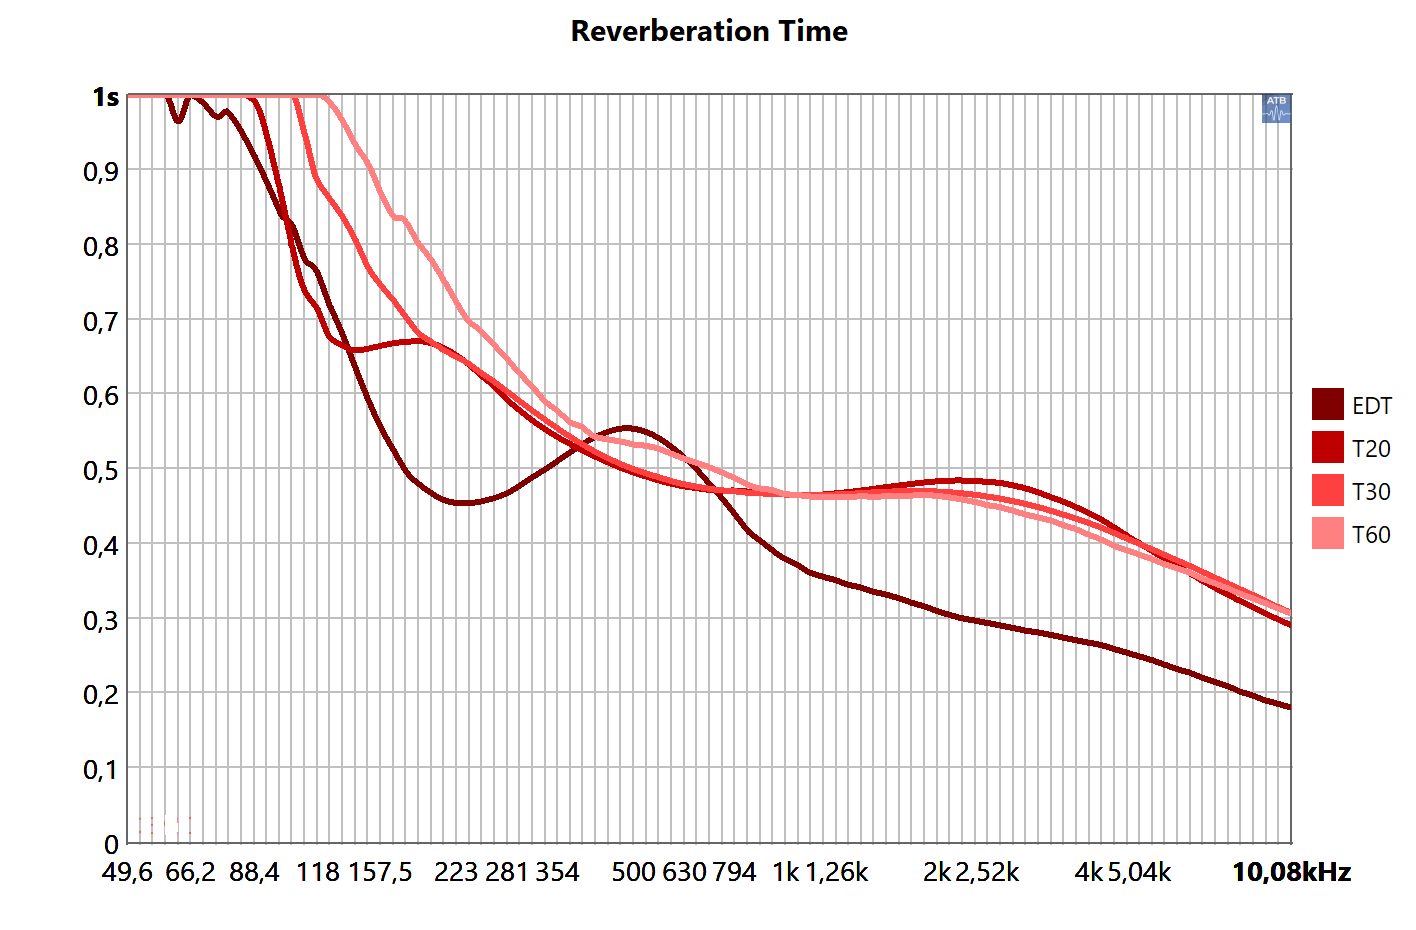
The reverberation time measurement shows the acoustic properties of a room. The ATB Audio Analyzer measurement complies with ISO, DIN.
The image shows the frequency response for defined reverberation times. A living room was measured.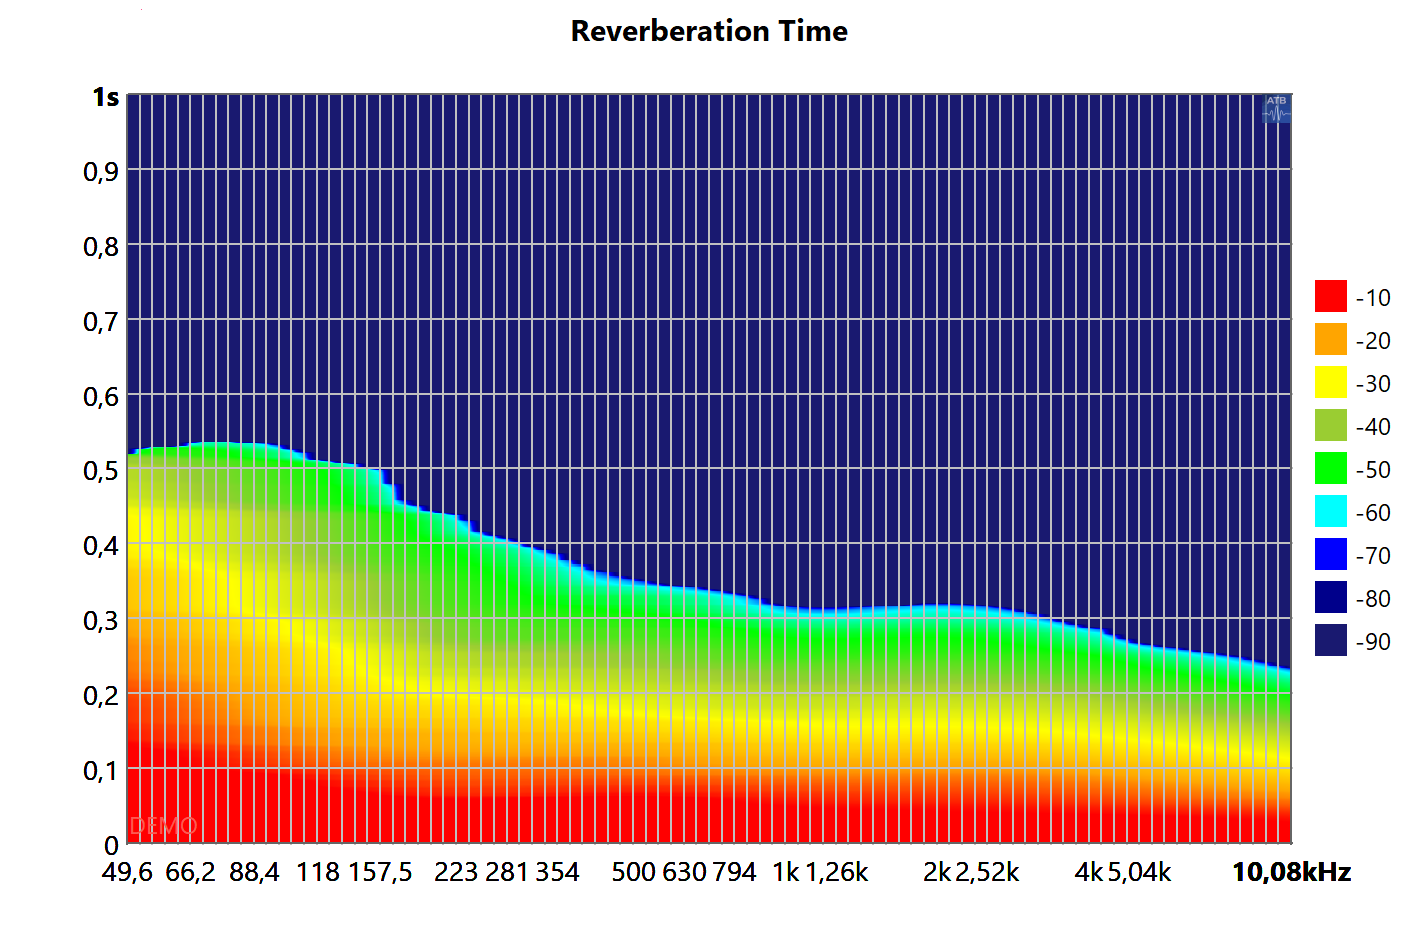
The image shows the decay spectrum of the room.
Measurement example:
Measurements of a DSP with Linkwitz high and low pass, 24dB/octave, 500Hz. For the measurement, the high and low frequencies are combined with an analogue addition circuit to replace the otherwise connected loudspeakers.

Distance meter for measuring the latency.
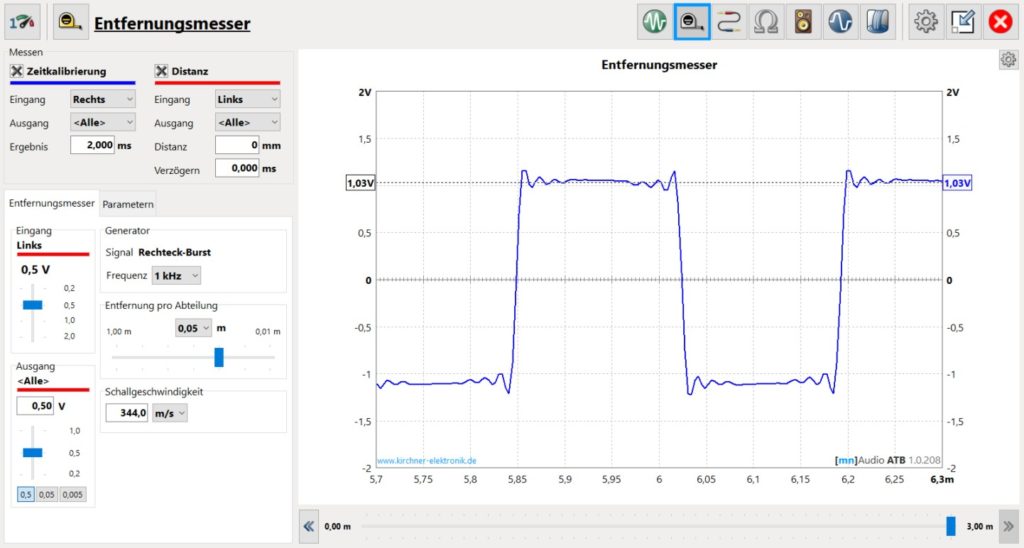
The time delay of the signal by the DSP must be known for the phase measurement and the waterfall.
The latency is 1.083ms,
corresponds to a distance of 0.357m for the sound.

Oscilloscope for measuring the step response
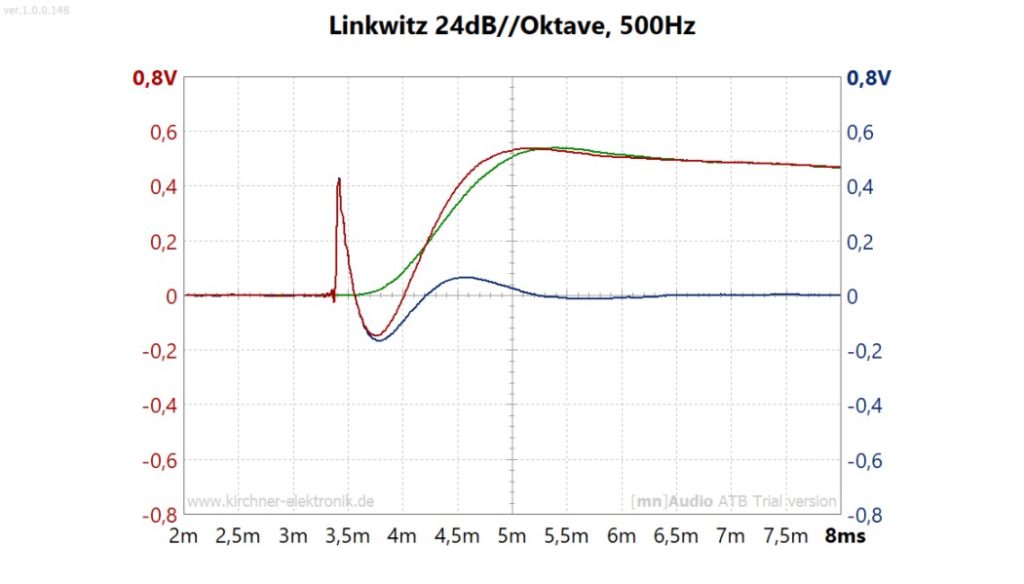
The picture shows the step response
blue = high pass, green = low pass, red = sum. The reverberation of the high-pass prevents a reproduction corresponding to the excitation. The output signal, red, is a square wave in an ideal system. The Linkwitz crossover has an ideal frequency response but the worst transient response.

Magnitude Measurement for electrical frequency and phase response, Linkwitz high and low pass 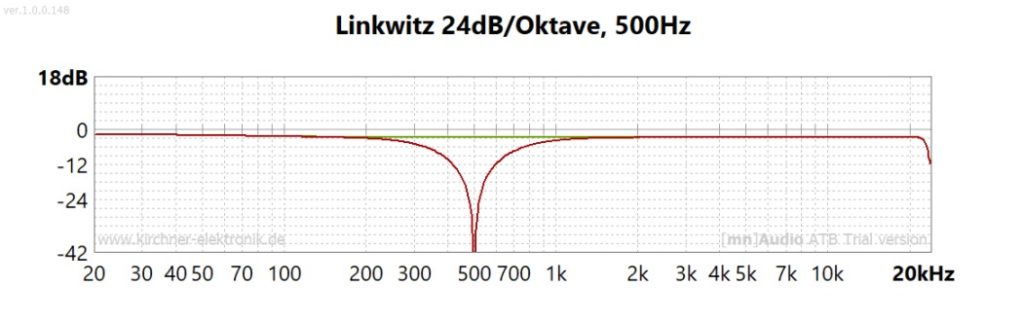
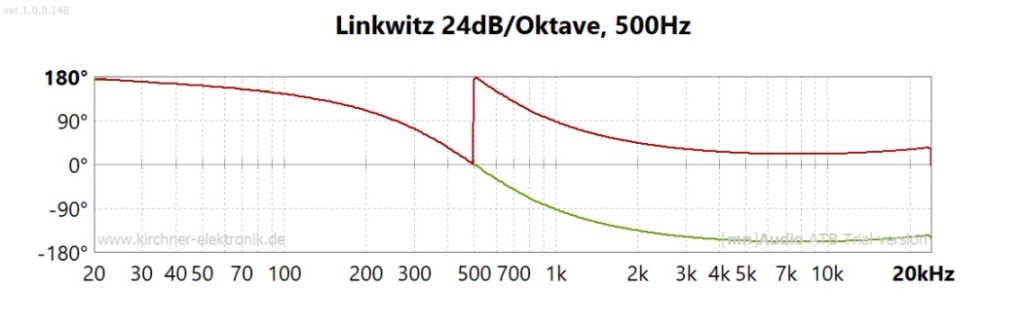
Green = in-phase, 4th order filter with a phase shift of 380°.
Red = high-pass inverted with phase shift of 180° at the crossover frequency.

Waterfall measurement from Linkwitz filter 24dB/octave, 500Hz
Displays the decay behaviour known from the FFT waterfalls
![]()
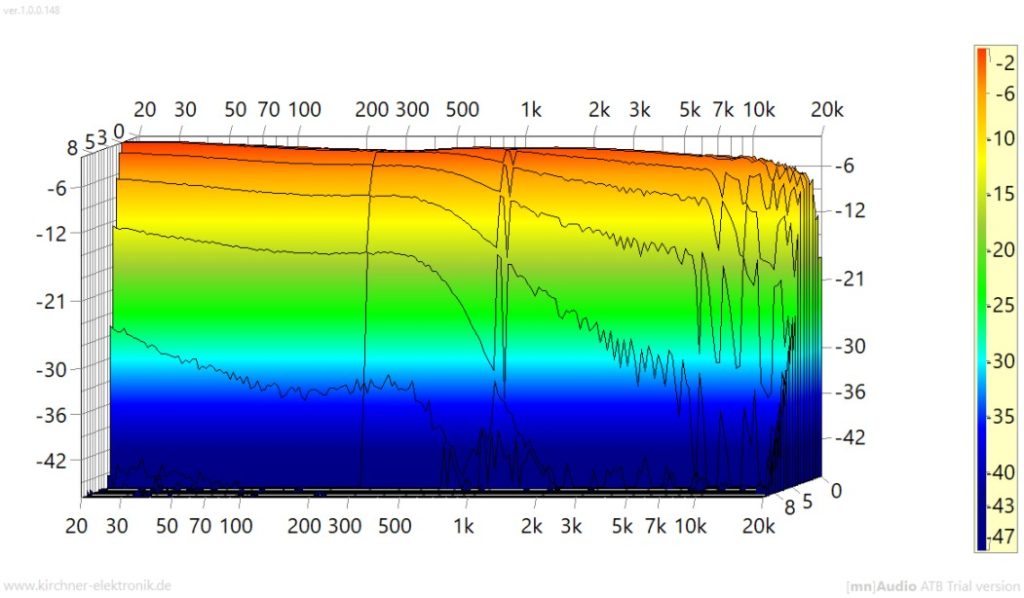
During decay, the lines dropping to the treble show the strong phase rotation.
The irregular course above 10 kHz shows the characteristic of the DSP.
Shows the transient response.
![]()
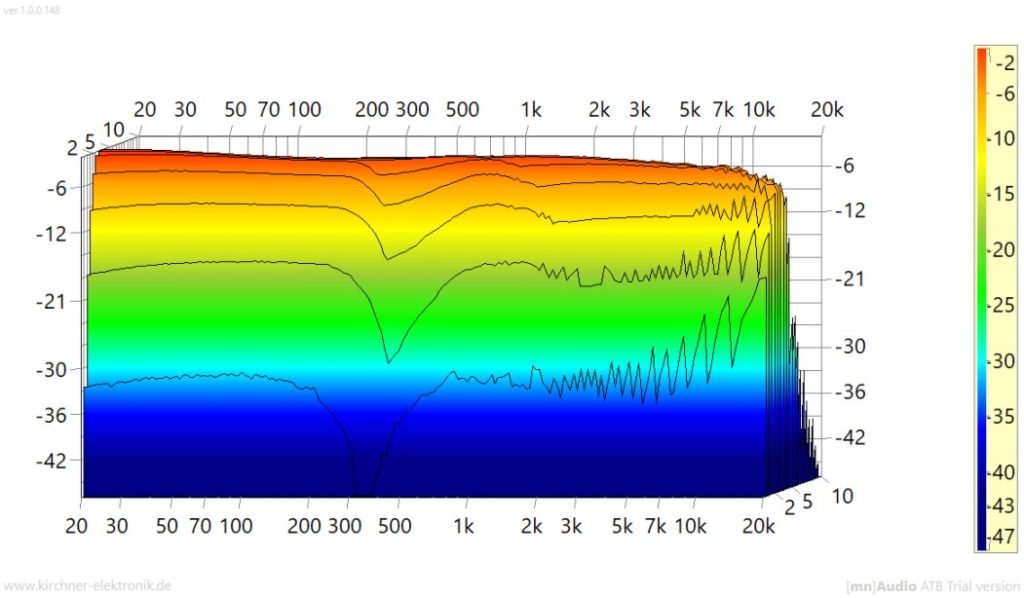
The transient response of the Linkwitz filter shows a notch at the crossover frequency. In this range, the signal and thus the music is reproduced with a delay. Since no mountain is visible during the decay, the music is not completely reproduced due to the missing part of the notch.
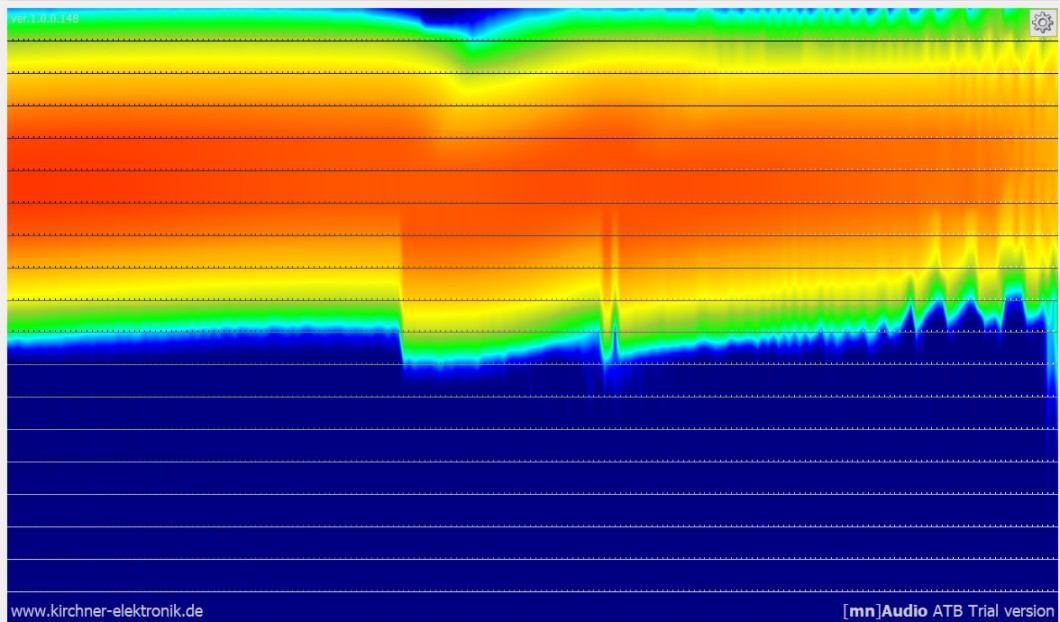
Shows the mountains from above.

More information in the Handbook